Foodhub Dataset: Data Analysis to Improve Business Outcomes
Published on January 26, 2024
FoodHub is a mobile app that provides food delivery services (Similar to UberEats). When an order is placed by a customer for a specific restaurant, the app will assign an delivery person to receive the food and delivery it to the customer. They will follow the map to reach the restaurant, pick up the food, and follow the map again to delivery to the customer. Once food is delivered, the customer will confirm reception and be allowed to review the order. The app is able to earn money by collecting a fixed margin per order.
Aim
My aim in analyzing this data is to understand customer order trends, and provide informed recommendations to improve business.
Data Cleaning
To clean the data, multiple steps were taken. Firstly, I had looked at the datatypes to see if they were accurate (ie. is the cuisine_type a categorical value?). Secondly, I removed all empty entries. Finally, I also edited the rating column for orders with a “Not Given” value, this was made NaN. Final table can be see in Table 1. In total, there are 1898 entries and 8 columns of data.
Table 1 - Cleaned Data Example
| order_id | customer_id | restaurant_name | cuisine_type | cost_of_the_order | day_of_the_week | rating | food_preparation_time | delivery_time |
|---|---|---|---|---|---|---|---|---|
| 1477147 | 337525 | Hangawi | Korean | 30.75 | Weekend | NaN | 25 | 20 |
| 1477685 | 358141 | Blue Ribbon Sushi Izakaya | Japanese | 12.08 | Weekend | NaN | 25 | 23 |
| 1477070 | 66393 | Cafe Habana | Mexican | 12.23 | Weekday | 5 | 23 | 28 |
| 1477334 | 106968 | Blue Ribbon Fried Chicken | American | 29.20 | Weekend | 3 | 25 | 15 |
| 1478249 | 76942 | Dirty Bird to Go | American | 11.59 | Weekday | 4 | 25 | 24 |
Table 2 - Summarized Data analytics
| count | mean | std | min | 25% | 50% | 75% | max | |
|---|---|---|---|---|---|---|---|---|
| cost_of_the_order | 1898.0 | 16.4 | 7.5 | 4.5 | 12.1 | 14.1 | 22.3 | 35.4 |
| rating | 1162.0 | 4.3 | 0.7 | 3.0 | 4.0 | 5.0 | 5.0 | 5.0 |
| food_preparation_time | 1898.0 | 27.3 | 4.6 | 20.0 | 23.0 | 27.0 | 31 | 35.0 |
| delivery_time | 1898.0 | 24.1 | 5.0 | 15.0 | 20.0 | 25.0 | 2.8 | 33.0 |
Data Exploration
Univariable Analysis
To understand the data better, I had a look at each variable to understand customer behaviours. To do this, I made histograms and boxplots of each column using Code 1 and Code 2 as an example.
Code 1:
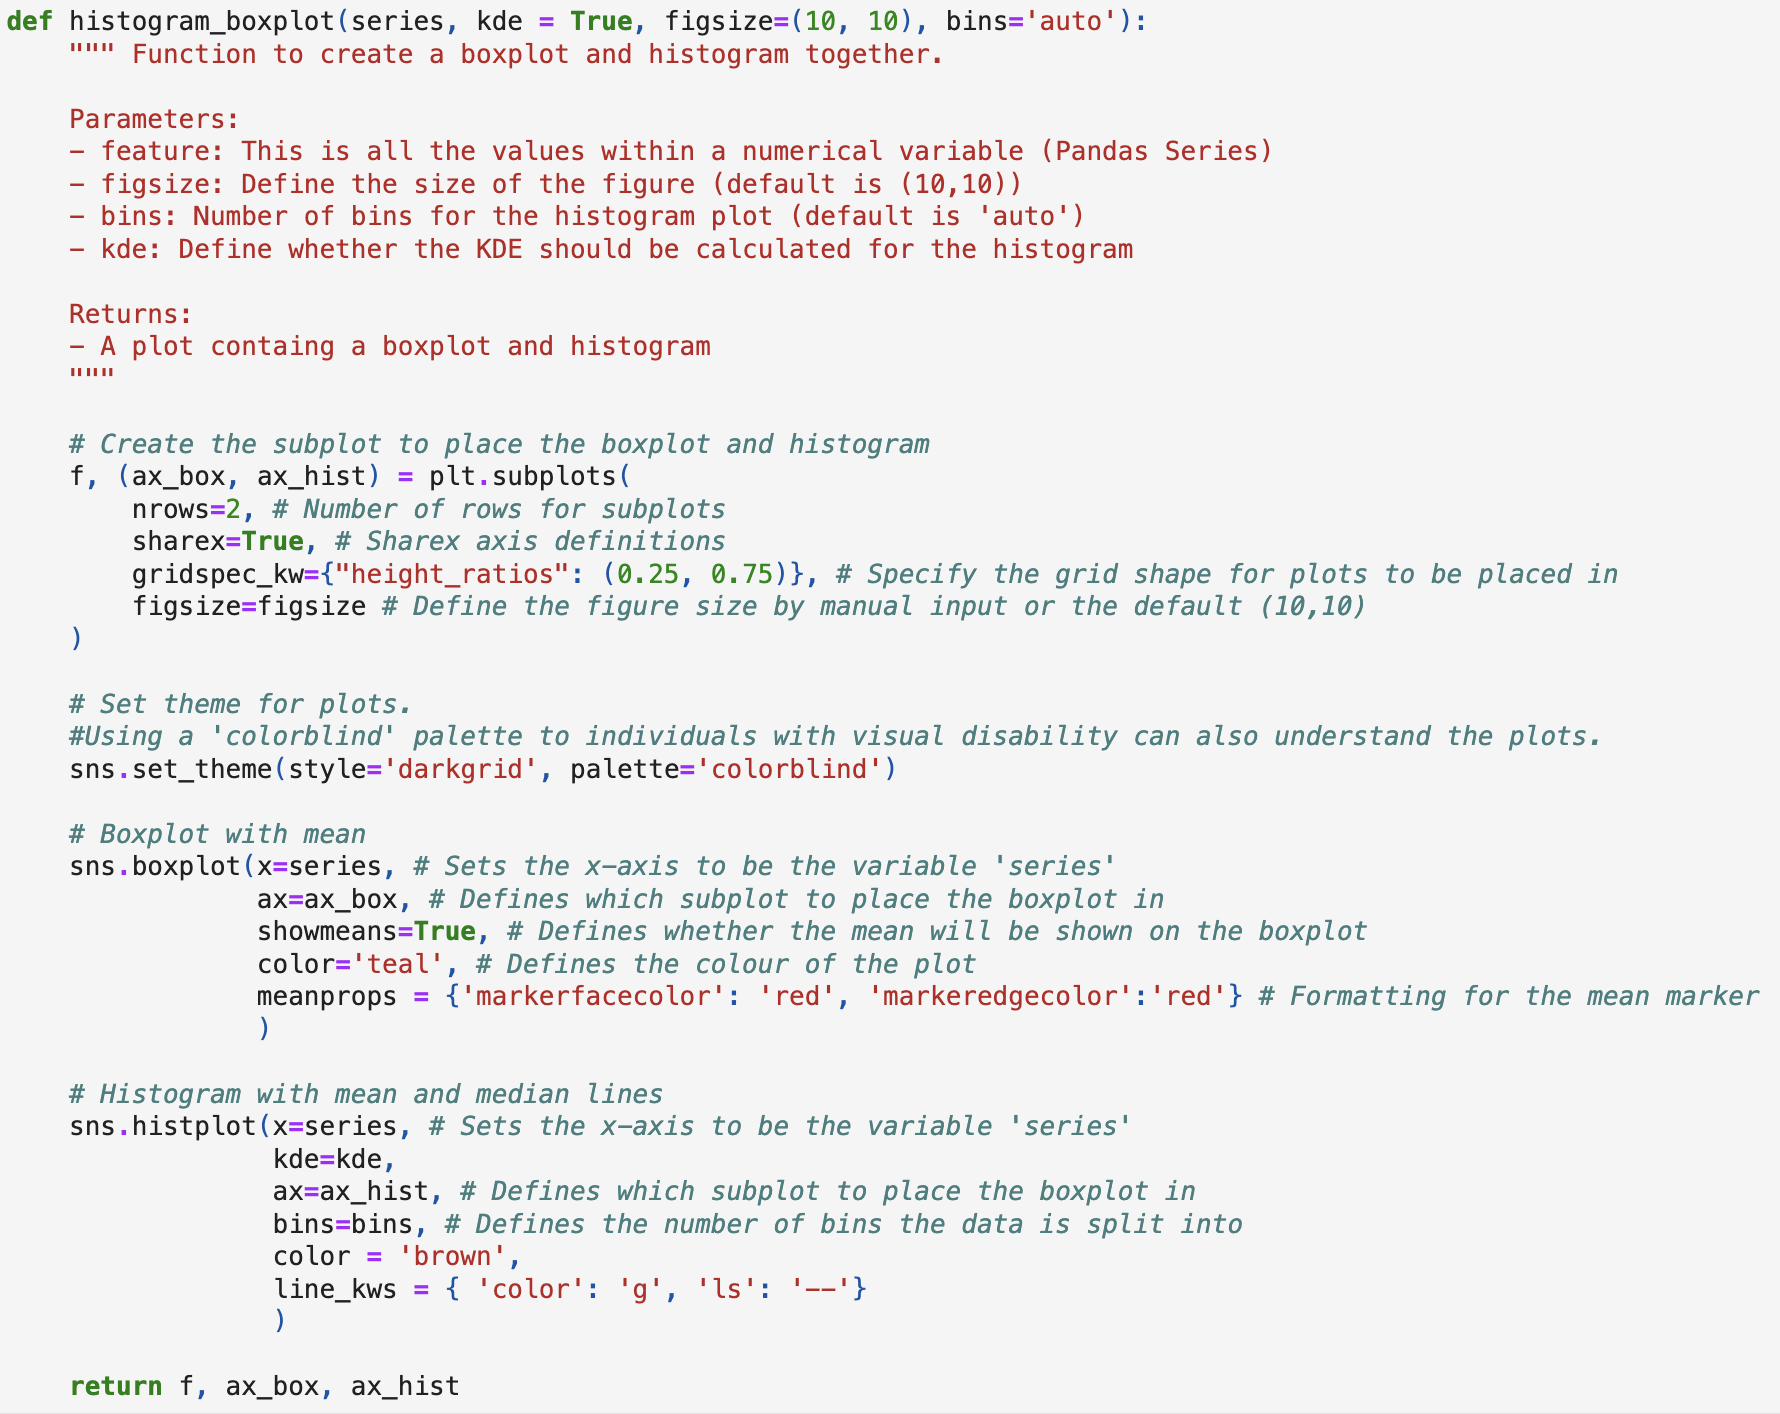
Code 2:

Using the above code, I was able to obtain a couple of important takeaways about customer behaviour.
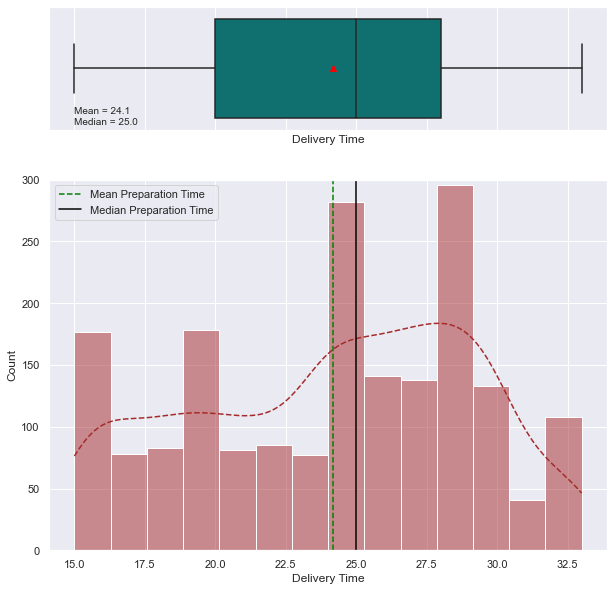
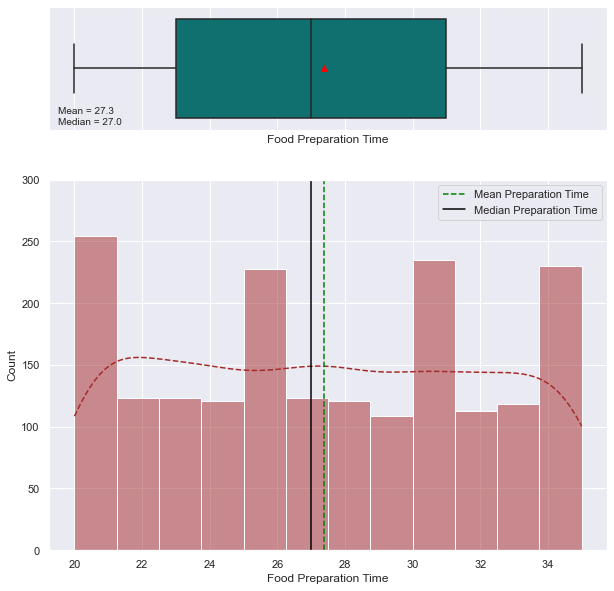
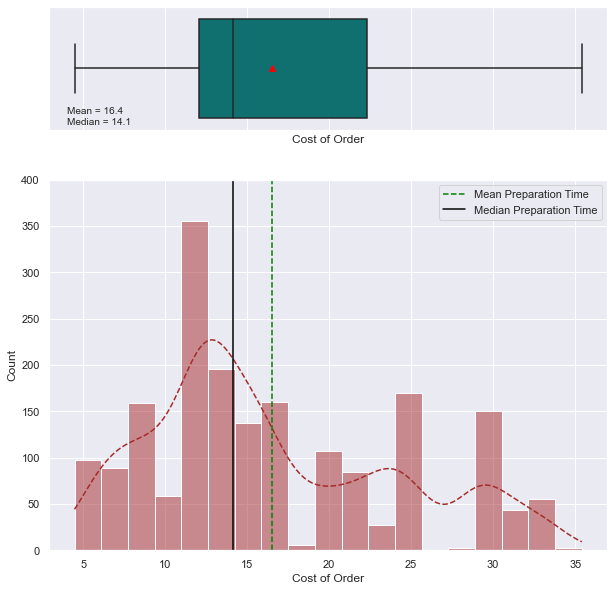
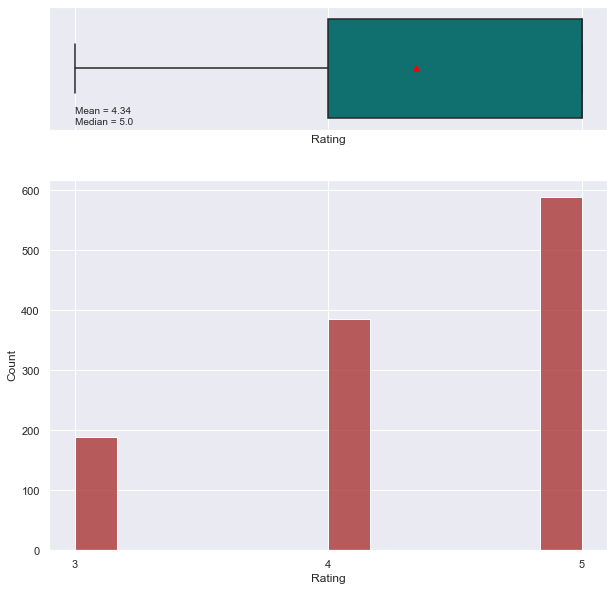
For delivery time (Figure 1A), average delivery time was 24.1 minutes, where a majority of orders were under 25 minutes. In comparison, food preparation time (figure 1B) was a bit longer with an average of 27.3 minutes, where majority of orders took under 27 minutes. Finally, average price (figure 1C) was 16.4 dollars, such that majority were under 14.1. The average rating of all orders was 4.3 (Figure 1D).
With this data,
Figure 1
A) Delivery Time
B) Food Preparation Time
C) Order Cost
D) Customer Rating
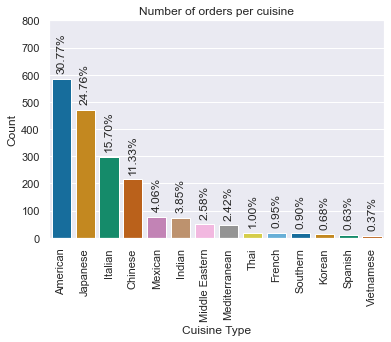
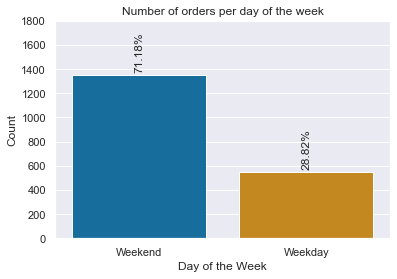
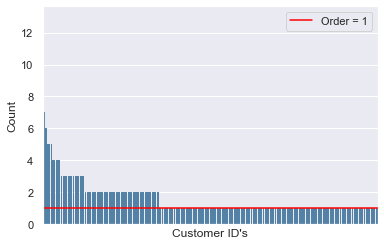
The data reveals that American and Japanese cuisines are the most popular (Figure 2A), accounting for over half of the total orders, while Vietnamese, Southern, Spanish, and French cuisines are the least preferred. Additionally, 71.18% of orders occur on weekends (Figure 2B), indicating a strong preference for weekend dining, which businesses could leverage with targeted promotions. Lastly, most customers place only one order (Figure 2C), though a small subset of frequent customers makes multiple purchases. To maximize growth, businesses should focus on popular cuisines, weekend marketing, and implementing loyalty programs to retain and engage customers.
Figure 2
A) Orders per Cuisine
B) Orders on weekdays vs. weekends
C) Orders per customer ID
Multivariable Analysis
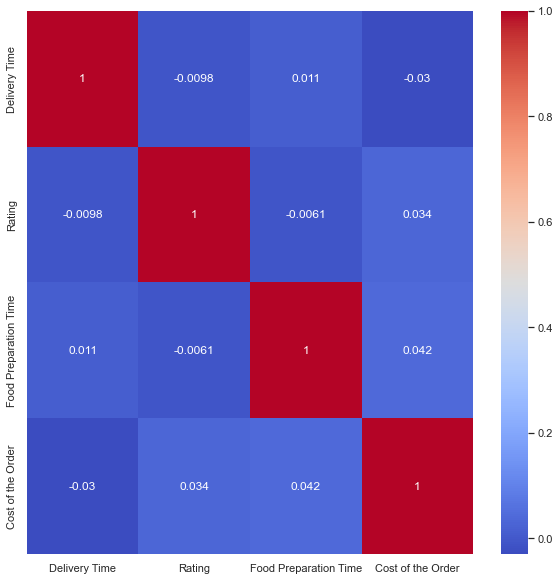
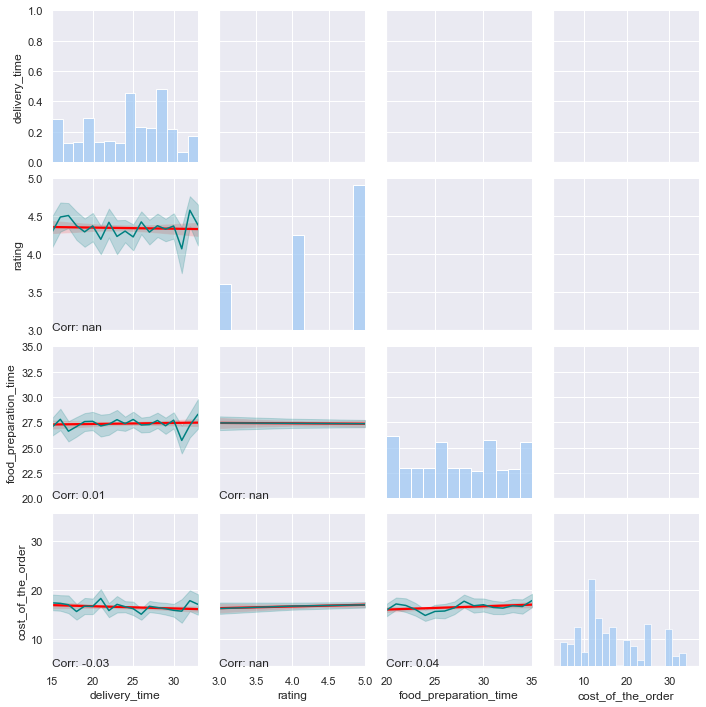
Based on the multivariate analysis in figure 3A and 3B, there doesn’t seem to be a significant trend between delivery time, food preparation time, price, and rating.
Figure 3
A) Heatmap
B) Pairplot
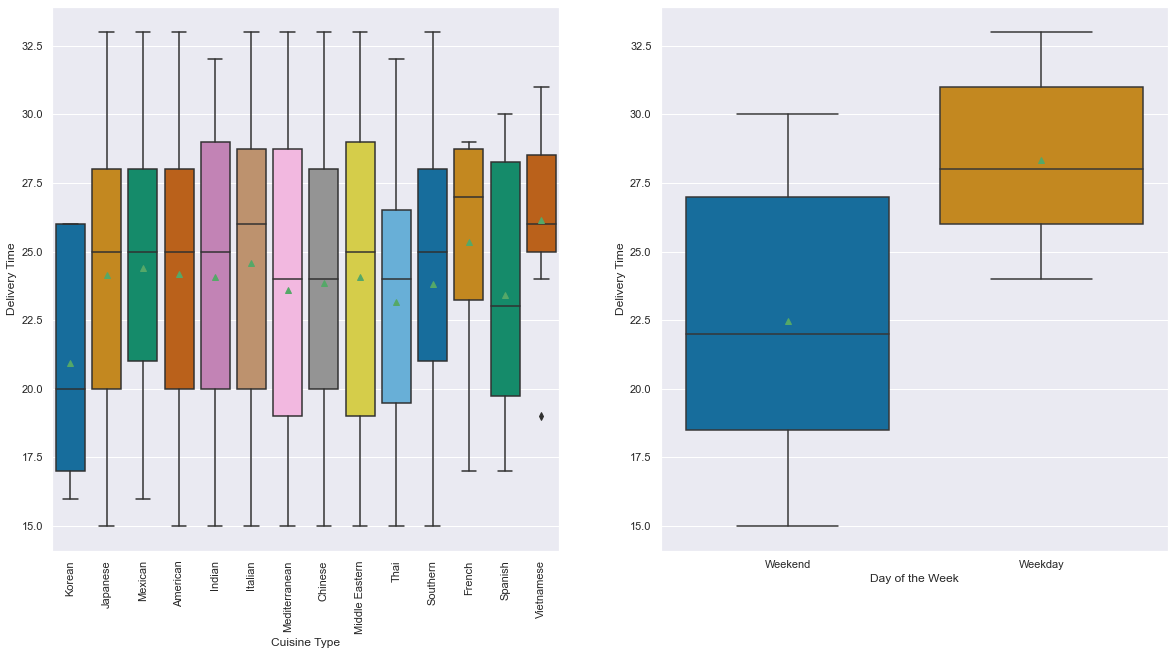
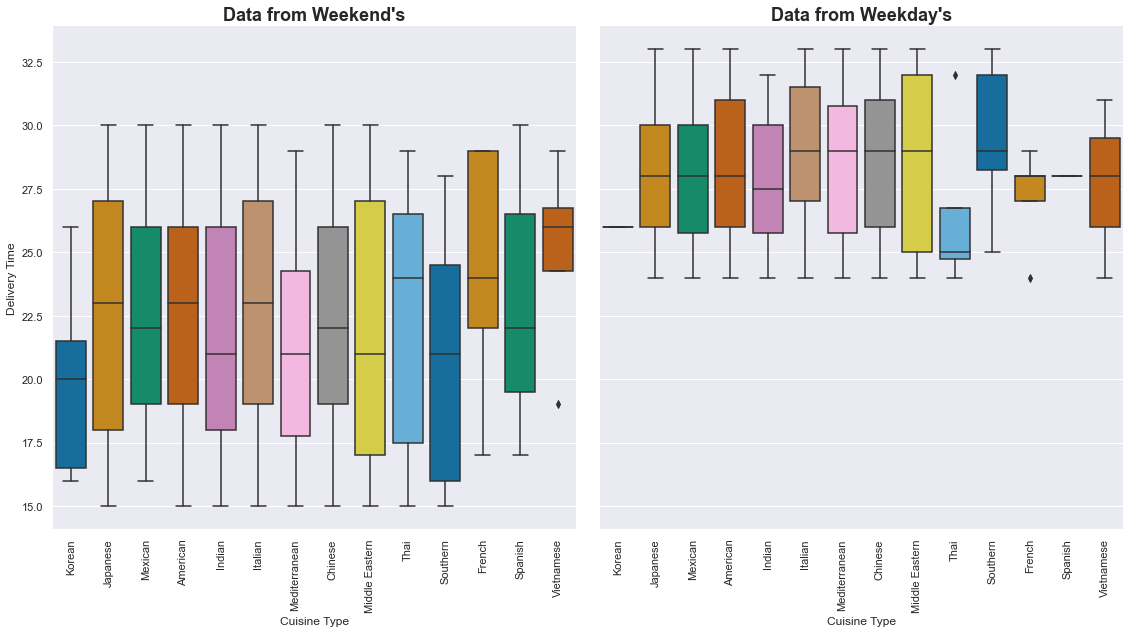
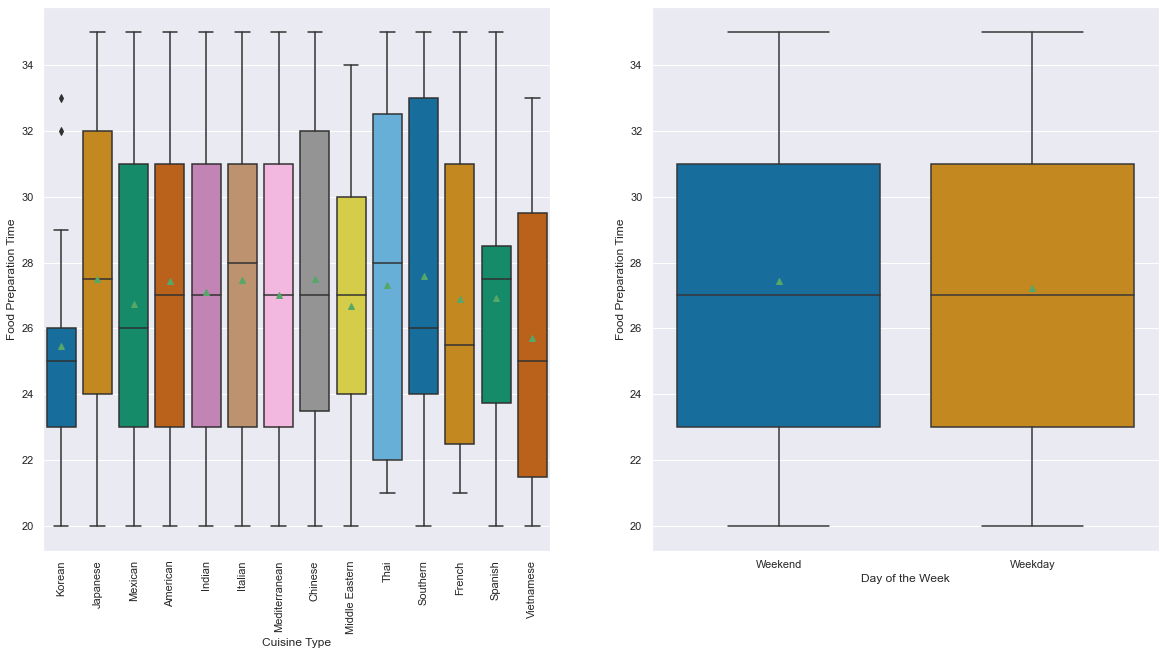
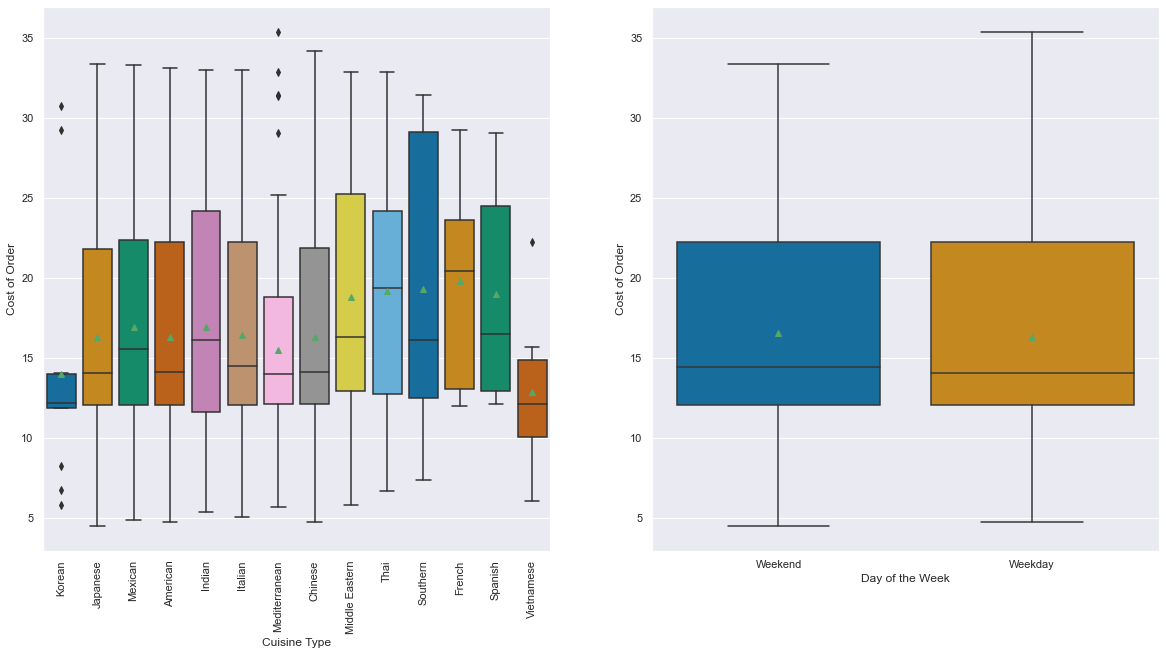
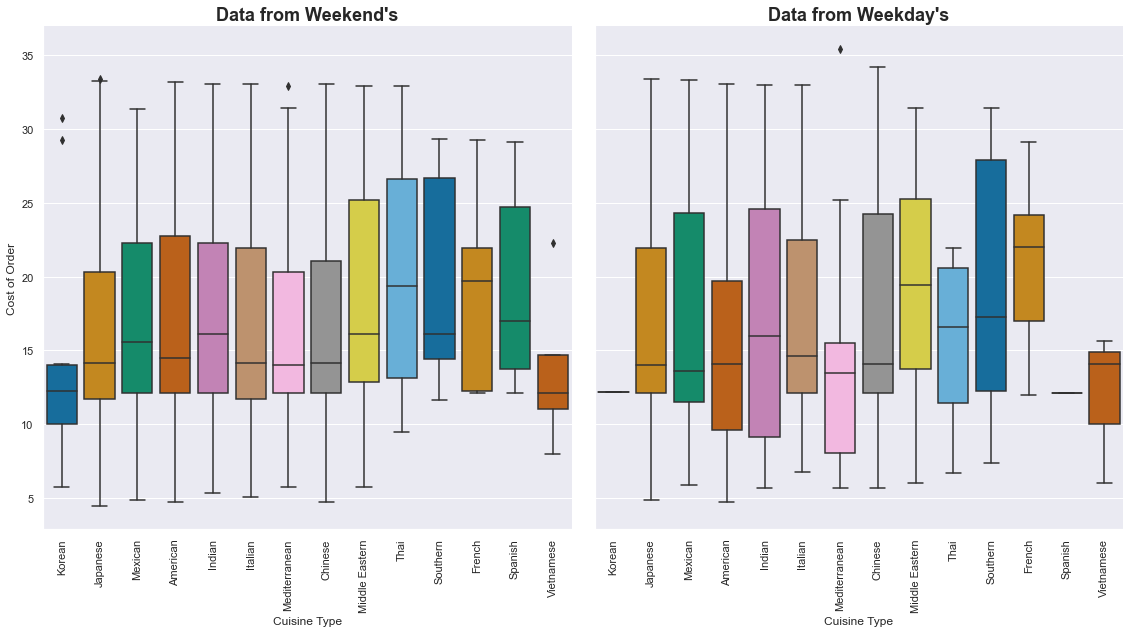
In my analysis of the delivery service data, I found consistent patterns across various metrics. Cost and preparation time remain remarkably stable, showing no significant variations across different cuisine types, days of the week, or order characteristics (Figure 4A, 4C). This suggests a level of operational consistency in pricing and food preparation. However, delivery time emerges as the standout metric, with a notable distinction between weekday and weekend performance (Figure 4B). Weekend deliveries are notably more efficient, averaging 22.4 minutes compared to weekday deliveries which stretch to 28.3 minutes. This difference could indicate potential operational challenges during weekdays, such as traffic, staffing constraints, or other logistical issues that impact the speed of food delivery. Despite the variations in delivery times, the underlying data reveals the service’s performance across different metrics.
Figure 4
A) Delivery Time
_
B) Food Preparation Time
_

C) Order Cost
_
Conclusion and recommendations
As I dig into the apps performance, some patterns emerge that might surprise both the company and its customers. Weekend deliveries dominate the landscape, but there’s a difference in how long it takes to get your food depending on the day of the week. It seems like something’s going on with the delivery team – maybe they’re stretched thin during weekdays or struggling to keep up with demand. Even more concerning is that many customers try the service once and never come back, which is a red flag for customer satisfaction. On a brighter note, the business is finding its sweet spot with orders over $20, proving that customers are willing to spend a bit more. Perhaps most interestingly, this analysis showed that factors like delivery time and preparation don’t seem to directly impact customer ratings – a finding that could lead to improvements in how the service operates.
Based on these insights, I would propose a strategic approach to addressing the delivery service’s challenges. To combat the low customer retention rate, implementing targeted promotional campaigns that encourage customers to return after their initial order, such as providing attractive discount coupons for repeat users would help. Recognizing the significant drop in weekday orders, I suggest introducing compelling incentives like 10% discounts to motivate customers to place orders during traditionally slower weekdays. To boost the average order value, the company could offer 20% discounts for orders exceeding $30, which could not only increase revenue but also provide additional value to customers. Lastly, to address potential staffing and performance issues during weekdays, I recommend creating a compensation structure that offers higher salaries for delivery drivers working on weekdays, which could improve worker morale and help balance the current weekend-heavy delivery model. These targeted recommendations aim to transform the current operational challenges into opportunities for growth and improved customer satisfaction.
In the end, this was just an excuse for me to practice my data skills so I don’t forget them forever. Thanks for reading! 🫰
